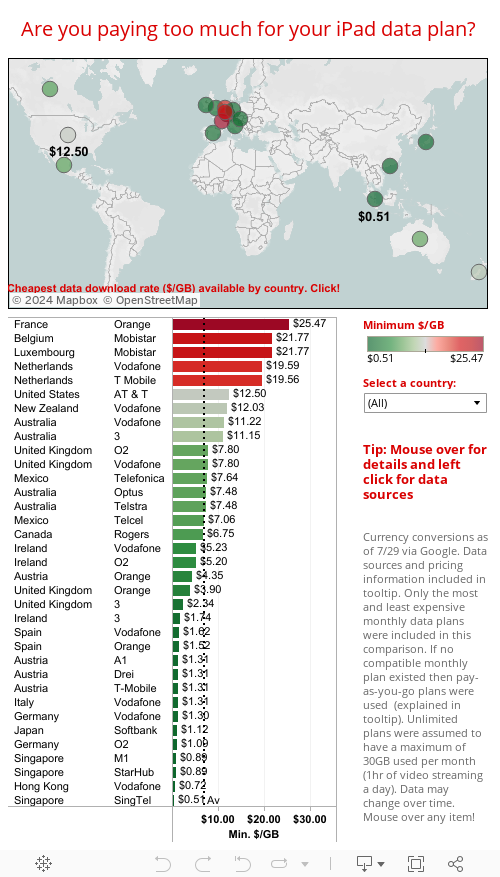
Use the above visualization to answer the following questions.
- By looking at the map, focusing on the colors, which region would you predict to have the highest average and why?
- Highlight the countries in Europe. Find the mean, median, mode, and range for these countries.
- Highlight the countries in North America. Find the mean, median, mode, and range for these countries.
- Highlight the eastern countries including Asia, Australia and New Zealand. Find the mean, median, mode, and range for these countries.
- Which geographical region has the highest mean?
- Which geographical region has the largest range?
- The cost of the data plan is based on dollars per gigabyte of usage ($/GB). How much would you pay for 9 GB of usage in the United State?
- How much would you pay for 7 GB in the Netherlands if you used T Mobile?
- Click on Australia. How does the number on the map relate to the numbers for Australia on the bar graph? You may need to hover over Australia.
If you are having problems with the visualization, follow this link: iPad Plans